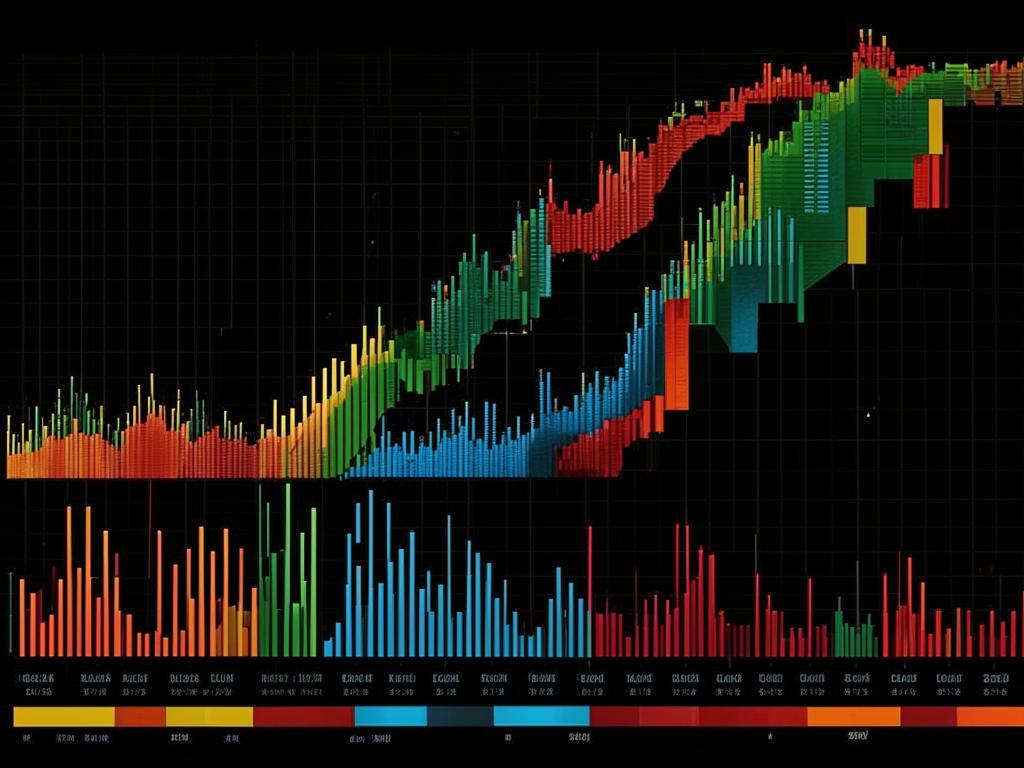
Understanding Bitcoin Liquidation Maps for Smarter Trading
Bitcoin liquidation maps are essential tools for navigating the volatile cryptocurrency market. These visual aids help traders identify where large liquidations may occur, offering insights into potential price movements and risk zones. By understanding how to read these maps, you can make more informed decisions and avoid common pitfalls.
What Is Liquidation in Crypto Trading?
In cryptocurrency trading, liquidation occurs when an exchange closes a trader’s leveraged position due to insufficient margin. This typically happens when the market moves sharply against the position.
- Long liquidations occur when prices drop.
- Short liquidations happen when prices rise unexpectedly.
How Bitcoin Liquidation Maps Work
CoinGlass provides real-time Bitcoin liquidation maps. These heatmaps highlight price levels where significant liquidations are expected. Traders use them to manage risk and optimize strategies.
Using Liquidation Maps Effectively
- Identify high-risk zones to avoid overleveraging.
- Time entry and exit points based on liquidation clusters.
- Combine maps with technical indicators for better analysis.
Common Mistakes to Avoid
Avoid trading blindly toward liquidity zones. Always consider broader market context. Misinterpreting map colors can lead to costly errors.

