Bitcoin Price Pattern Signals Potential New Highs
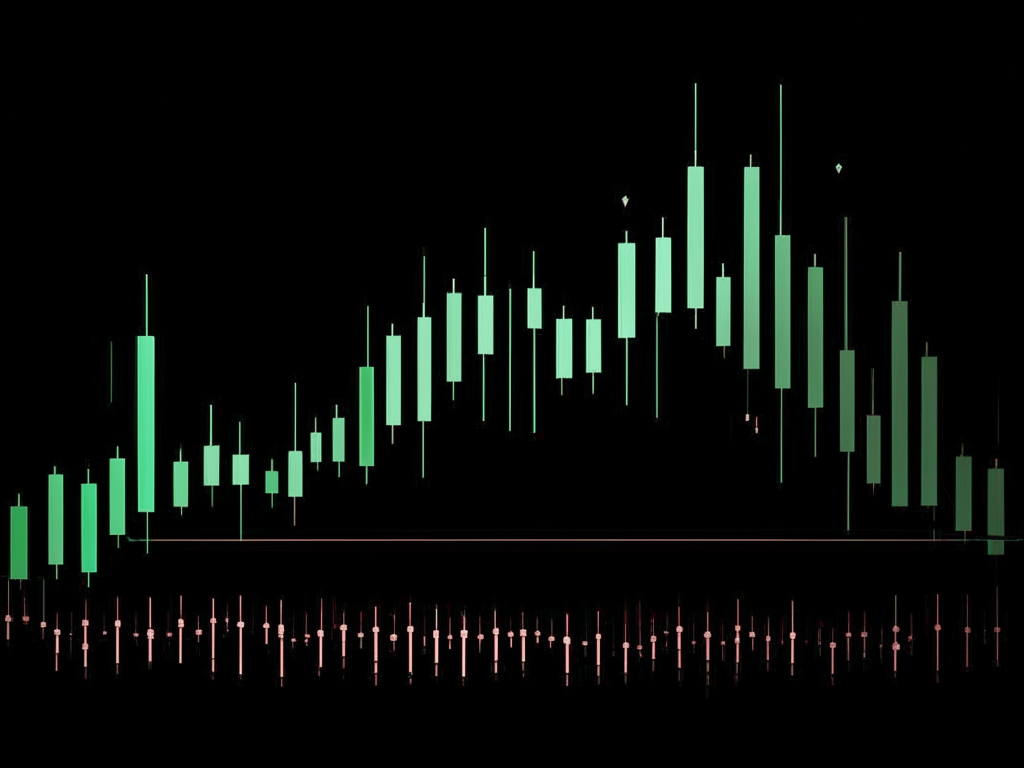
Recent analysis of Bitcoin price movements reveals a bullish engulfing candlestick pattern on the daily chart. This technical formation has accurately predicted new local highs 78% of the time since 2021, suggesting possible upward momentum for Bitcoin.
Understanding the Bullish Engulfing Pattern
The bullish engulfing pattern appears when a candle’s body completely covers the previous candle’s body, indicating potential reversal from bearish to bullish sentiment. Valid patterns must meet three criteria:
- Engulf at least the two prior candles
- Form during a corrective phase’s conclusion
- Show subsequent structural breaks confirming momentum
Historical Performance and Market Context
Since January 2021, Bitcoin has displayed 19 confirmed bullish engulfing patterns. Fifteen resulted in new local highs within days or weeks (78% success rate). All occurred during broader bull markets, with only two exceptions in May 2024 and March 2025.
Current Market Conditions and Liquidity
Bitcoin has attracted over $544 billion in capital since November 2022, pushing its realized market cap to a record $944 billion. These liquidity levels mirror late 2022 conditions that preceded significant price appreciation.
Conclusion
The current bullish engulfing pattern, combined with strong liquidity metrics, suggests Bitcoin may be preparing for another upward move. Historical precedent indicates this technical formation often precedes meaningful price advances during bull markets.

